You’re here because you want to use Power BI with UKG Pro Data.
You’re not the only one. Here’s a solution that might interest you.
The solution comes with all the code you need to run reports in UKG People Analytics and have the data show up in Power BI. The Power BI model has measure based on payroll amounts and hours. We’ll be adding head count statistics shortly. All the basics are included – like Job and org Level information.
So, let’s point out a few key things for business users and technical folks:
For business users:
- This works on a fiscal year, not a calendar year. You can do analysis by Payroll Cycle. But if you want to share data across the organization, the solution will perform detail accruals and reversals so that these reports tie to your fiscal periods.
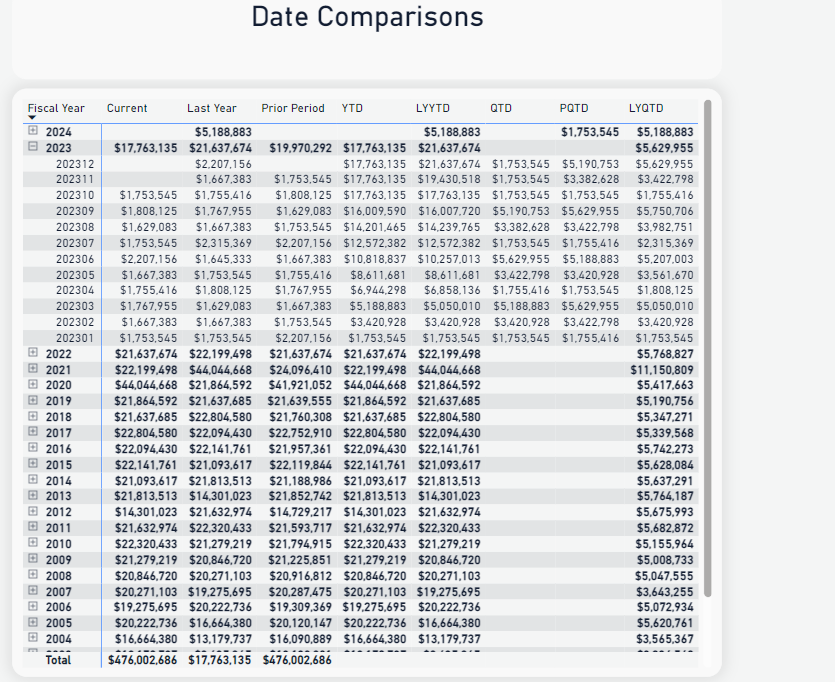
- A variety of period logic is built in, including:
Current Period, Last Year Current Period, Prior Period, Year To Date, Last Year Year To Date, Quarter To Date, Prior Quarter to Date, Last Year Quarter To Date. This date logic applies to hours and amounts for regular and overtime. It can also apply to any other new items you decide to measure.
For technical folks:
- The solutions uses:
PowerShell or Python to run Reports as a Service.
SQL Server
PowerBI - The solution is designed for “on-premise” technologies running in virtual machines. We’re building a full, serverless cloud solution.
- We transform data in SQL before loading into Power BI. This means that we can use the data for other solutions – not just Power BI.
- We use calculation groups, parameters and a measures table in Power BI to make the code as easy to support and extend as possible.
Here’s a video of the Power BI model.
And below is more detail of each part of the solution:
People Analytics Reports – Cognos BI
People Analytics Reports – Cognos BI
We’ve created six reports for the sample.
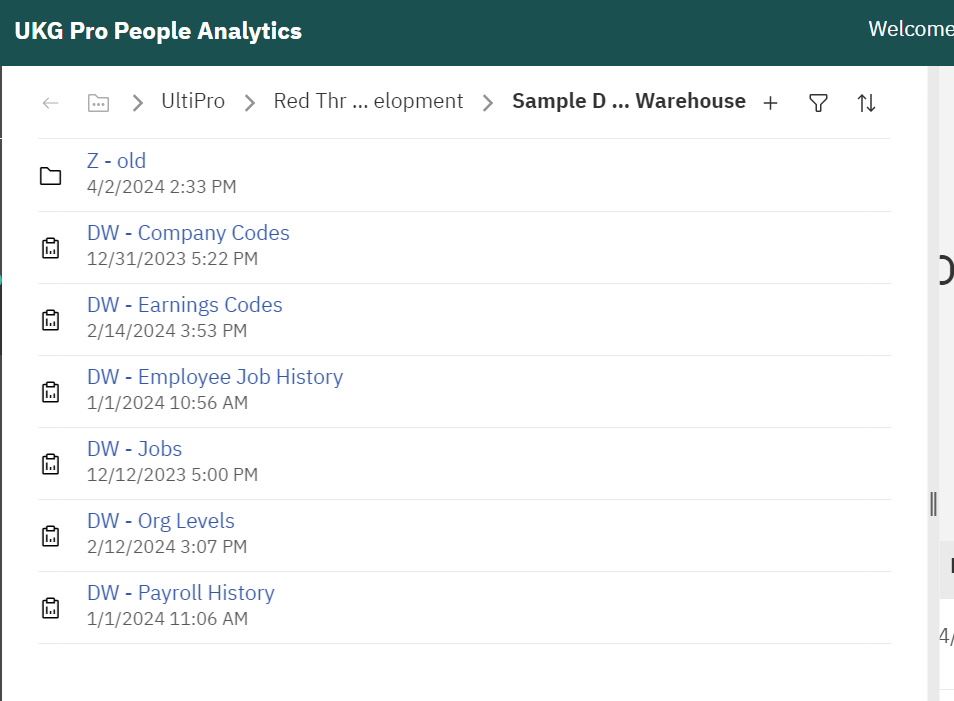
These four reports are designed to completely refresh the data every time they run:
DW – Company Codes
DW- Earnings Codes
DW – Jobs
DW – Org Levels
These two reports will run for the previous two weeks. This can be adjusted to your requirements. When we set up the initial load with you, we’ll provide versions that can be run for longer periods to load the data.
DW – Employee Job History
DW – Payroll History
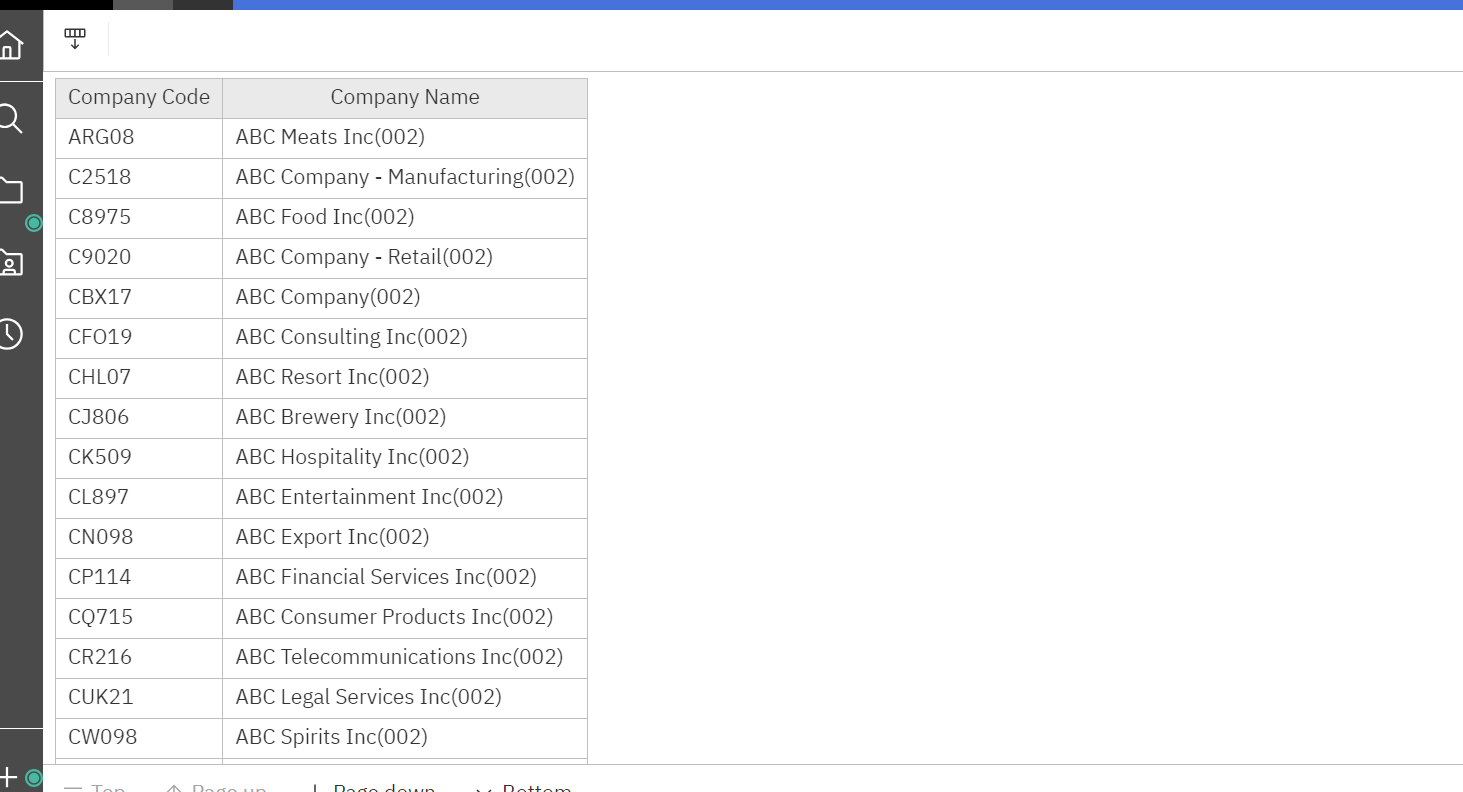
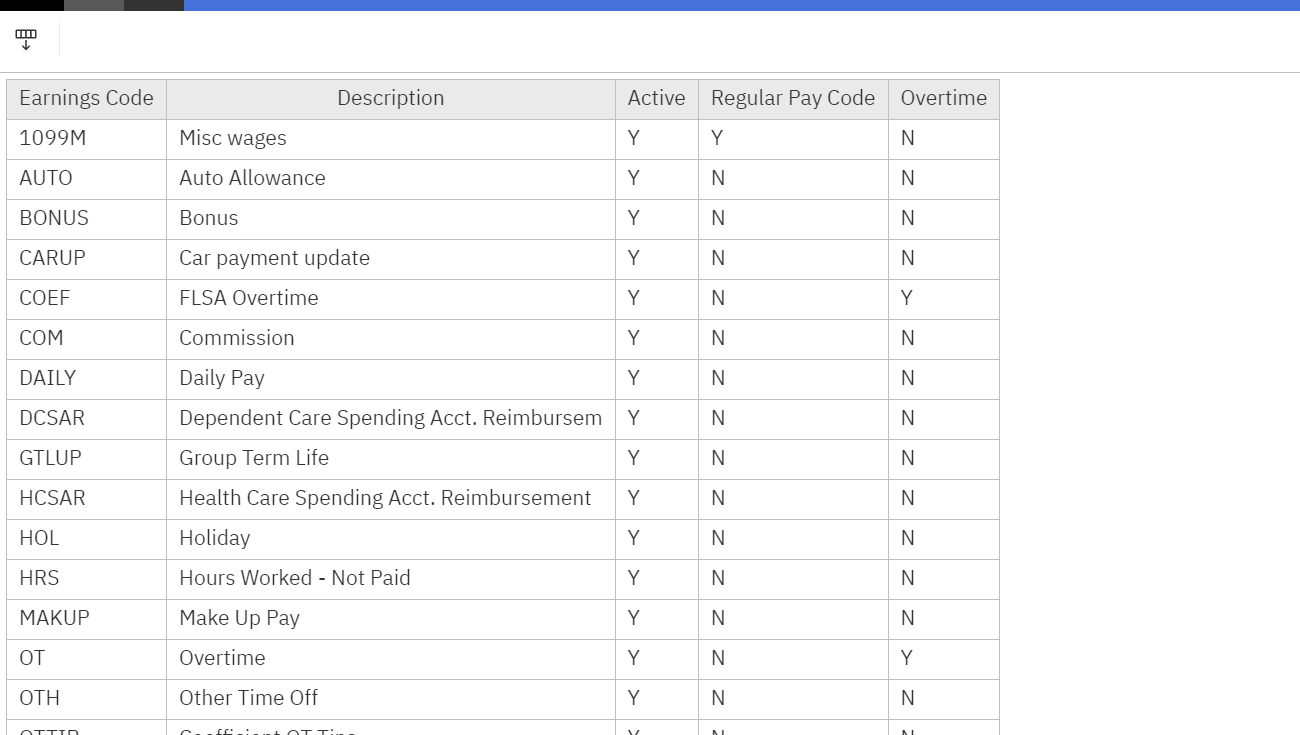
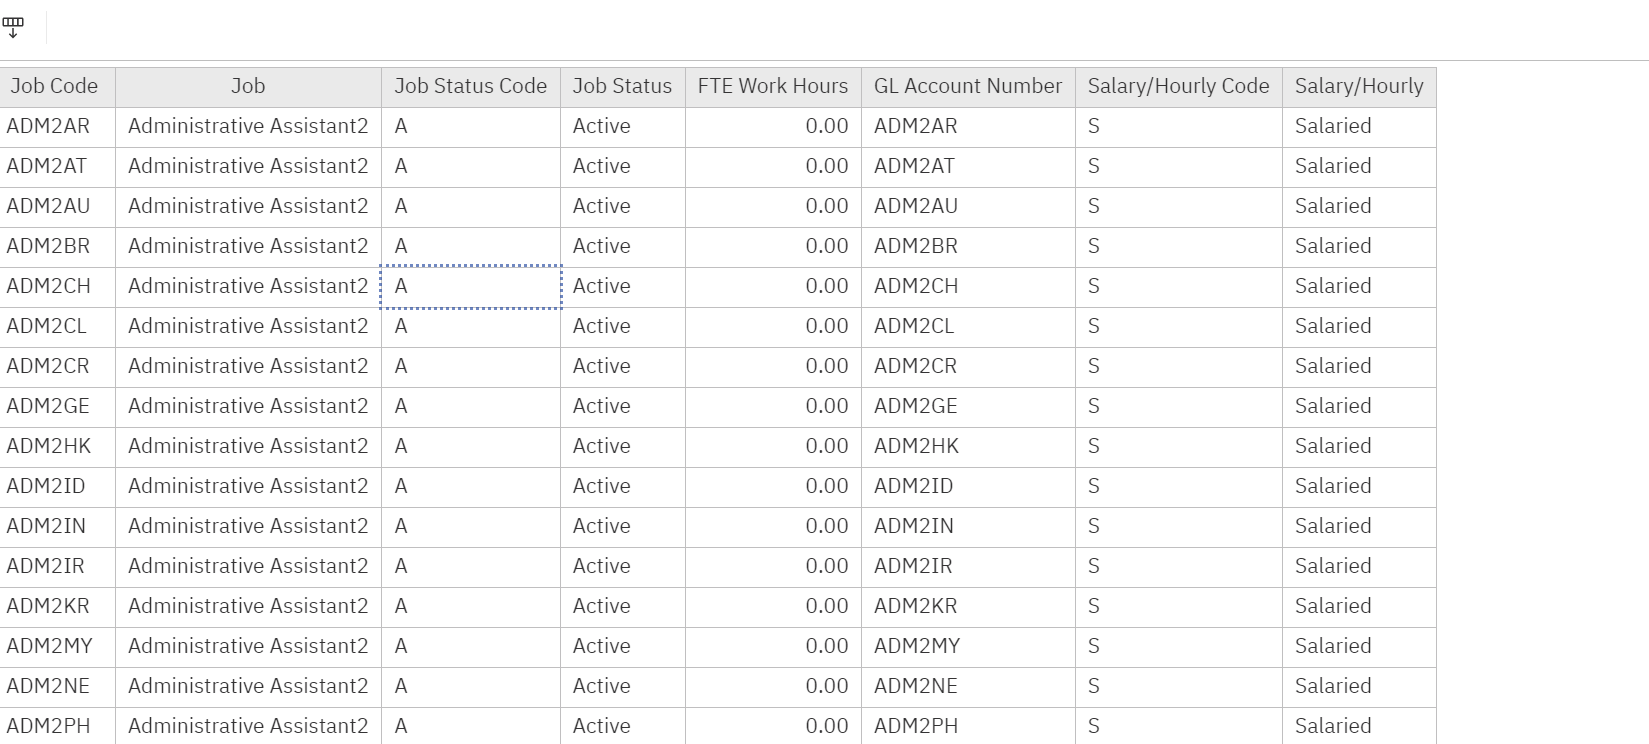
The reports are designed for use in Reports as Service – no fancy formatting involved. Here are screen shots of what each report provides with some additional information.
DW – Company Codes
DW – Earnings Codes
DW – Jobs
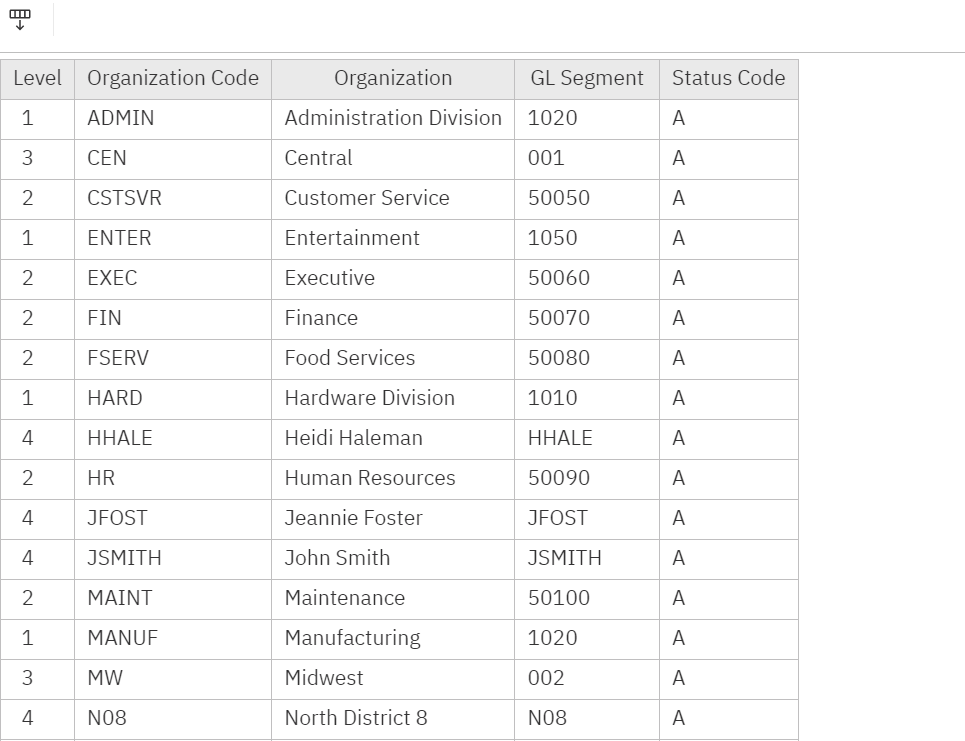
DW – Org levels
You’ll see that we include all org Levels in one report. In the data model, we break this one table into four separate dimensions. You can see that in the data model later in the post.
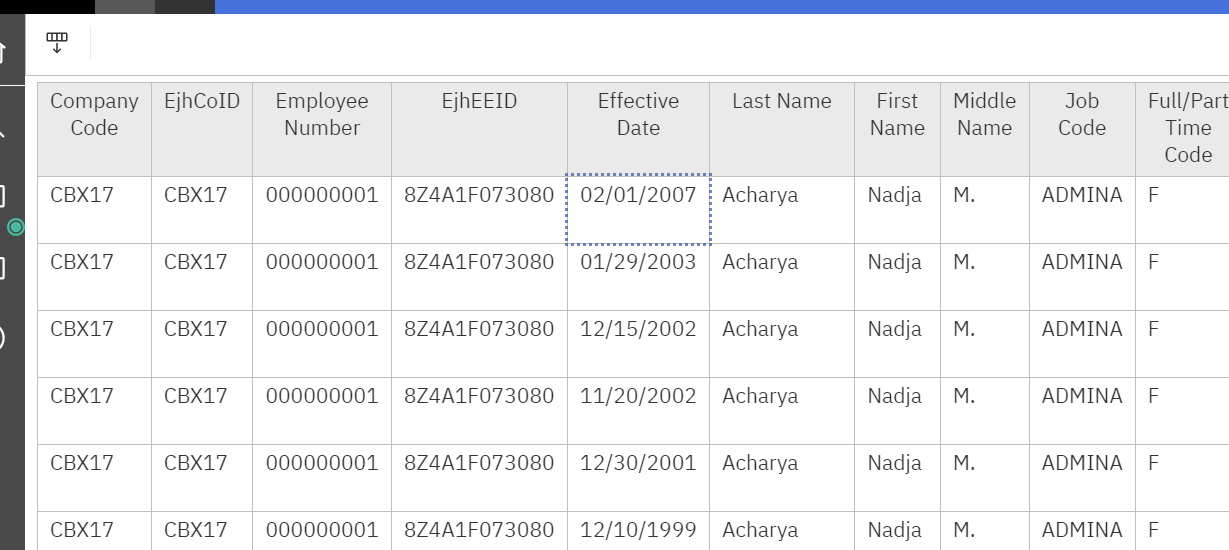
DW – Employee Job History
Each Employee Job History Record shows information for Job, Full/Part time, Org Levels and Pay Rates. We perform several transformations in SQL to create slow changing dimensions and to eliminate duplicates when multiple changes were made retroactive to the same data. We discuss the challenges with this data in this post.
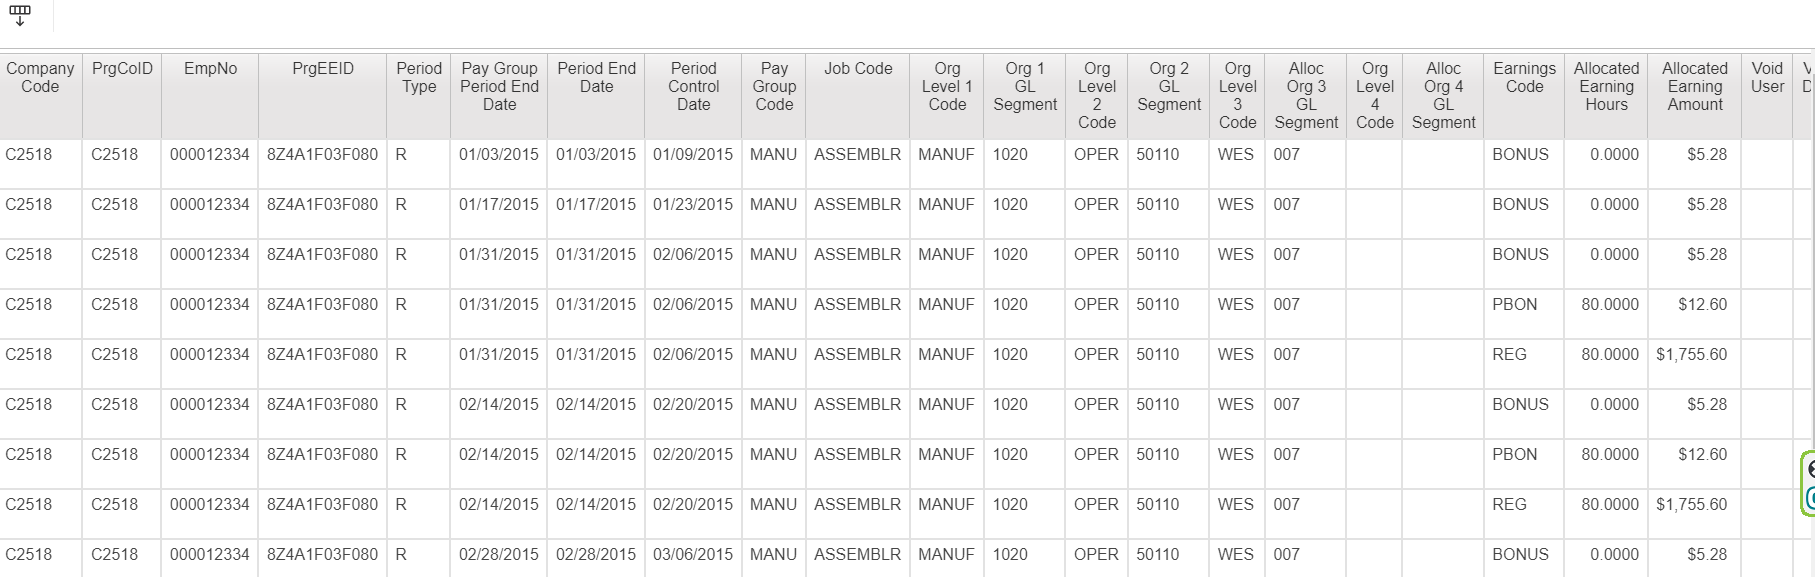
DW – Payroll History
All org levels are included – as well as basic job information.
Using Reports as a Service
We go into detail about Reports as A Service here and why we prefer it for data warehouse integration.
We’ve built versions of our wrapper code in both Python and PowerShell.
SQL Database Features
We prefer having a SQL Database for several reasons:
- Power BI is not the only tool that needs the data
HR Payroll Data gets sent to many different places. Having it in SQL means it can be used for multiple purposes – not just analytics. - We agree fully with Roche’s Maxim – data should be transformed as far upstream as possible and as far downstream as necessary.
- Adding functionality is easier in SQL. We mentioned above that we have code to accrue your payroll data to match your fiscal periods. We’ve done that in SQL.
Without diving deeply into the technical weeds, you’ll see several tables that aren’t just places to store the report data.
Dbo.etlReportsCtl is a control table. This allows us to add more data from UKG to SQL without writing additional stored procedures.
Dbo.EmployeeJobHistoryFinal takes care of the duplicate change problems we discussed above.
The three SCD tables – dbo.SCDJob, dbo.SCDOrgLevels and dbo.SCDPay are “slow changing dimensions”. These tables allow us to answer questions of turnover, transfers and pay changes within given periods.

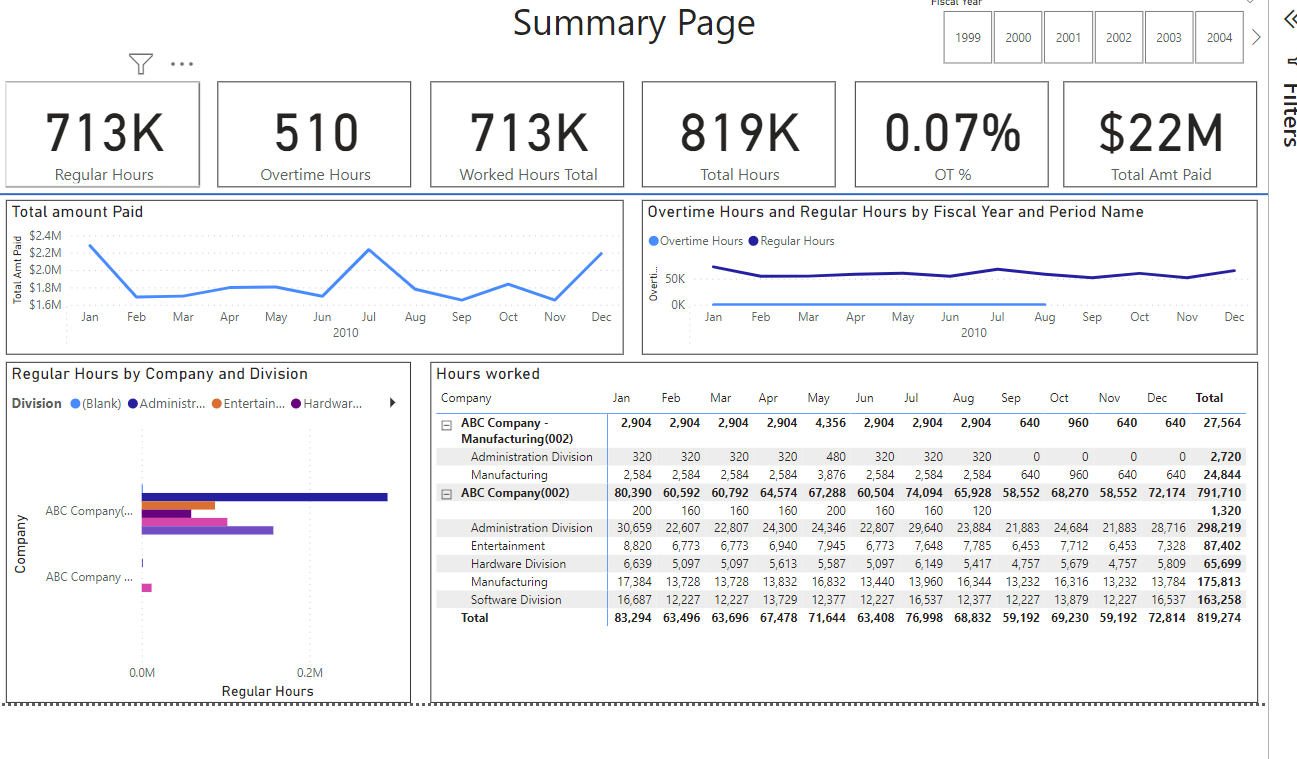
The Power BI Model
We have a video preview of Power BI here.
Before we start, let’s acknowledge that EVERY SINGLE PERSON reading this blog post will have a different idea of what should go onto a PowerBI page.
We’re here to deliver the data and build the model. We really think it’s best if in-house folks make it “pixel perfect” for their teams.
That said, here’s the basic layout- with key measures like Overtime, a full selection of companies years, org levels, and job titles.
Looking at the model, you’ll see all expected tables – including a separate one for each org level. There’s also a date table (built in SQL) and a measure table (which is Power BI best practice)
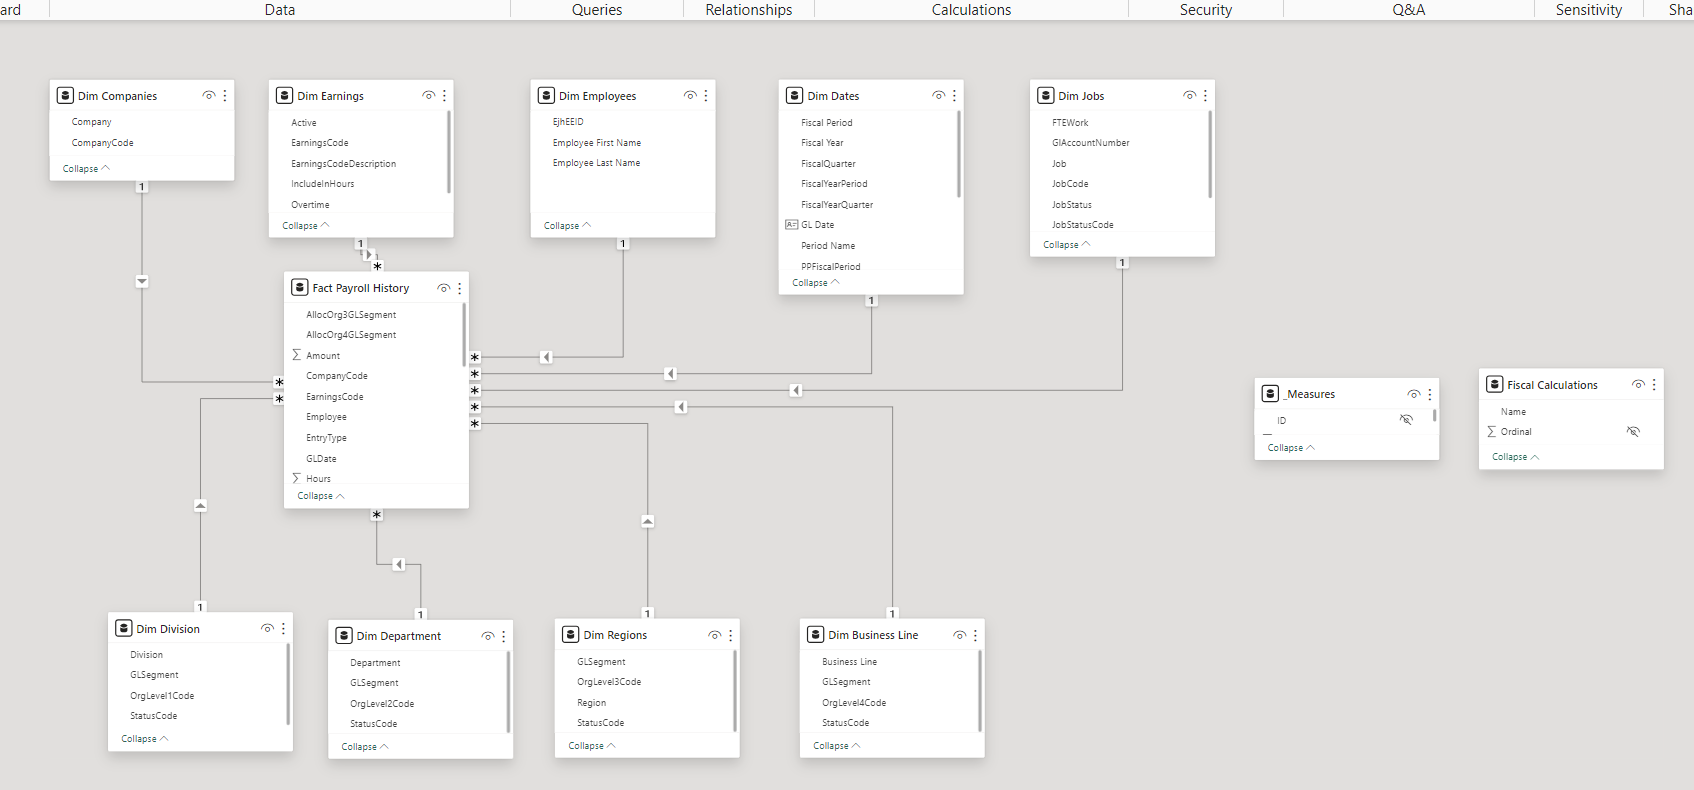
We’ve included many different date calculations as we mentioned above, including: Current Period, Last Year Current Period, Prior Period, Year To Date, Last Year Year To Date, Quarter To Date, Prior Quarter to Date, Last Year Quarter To Date.
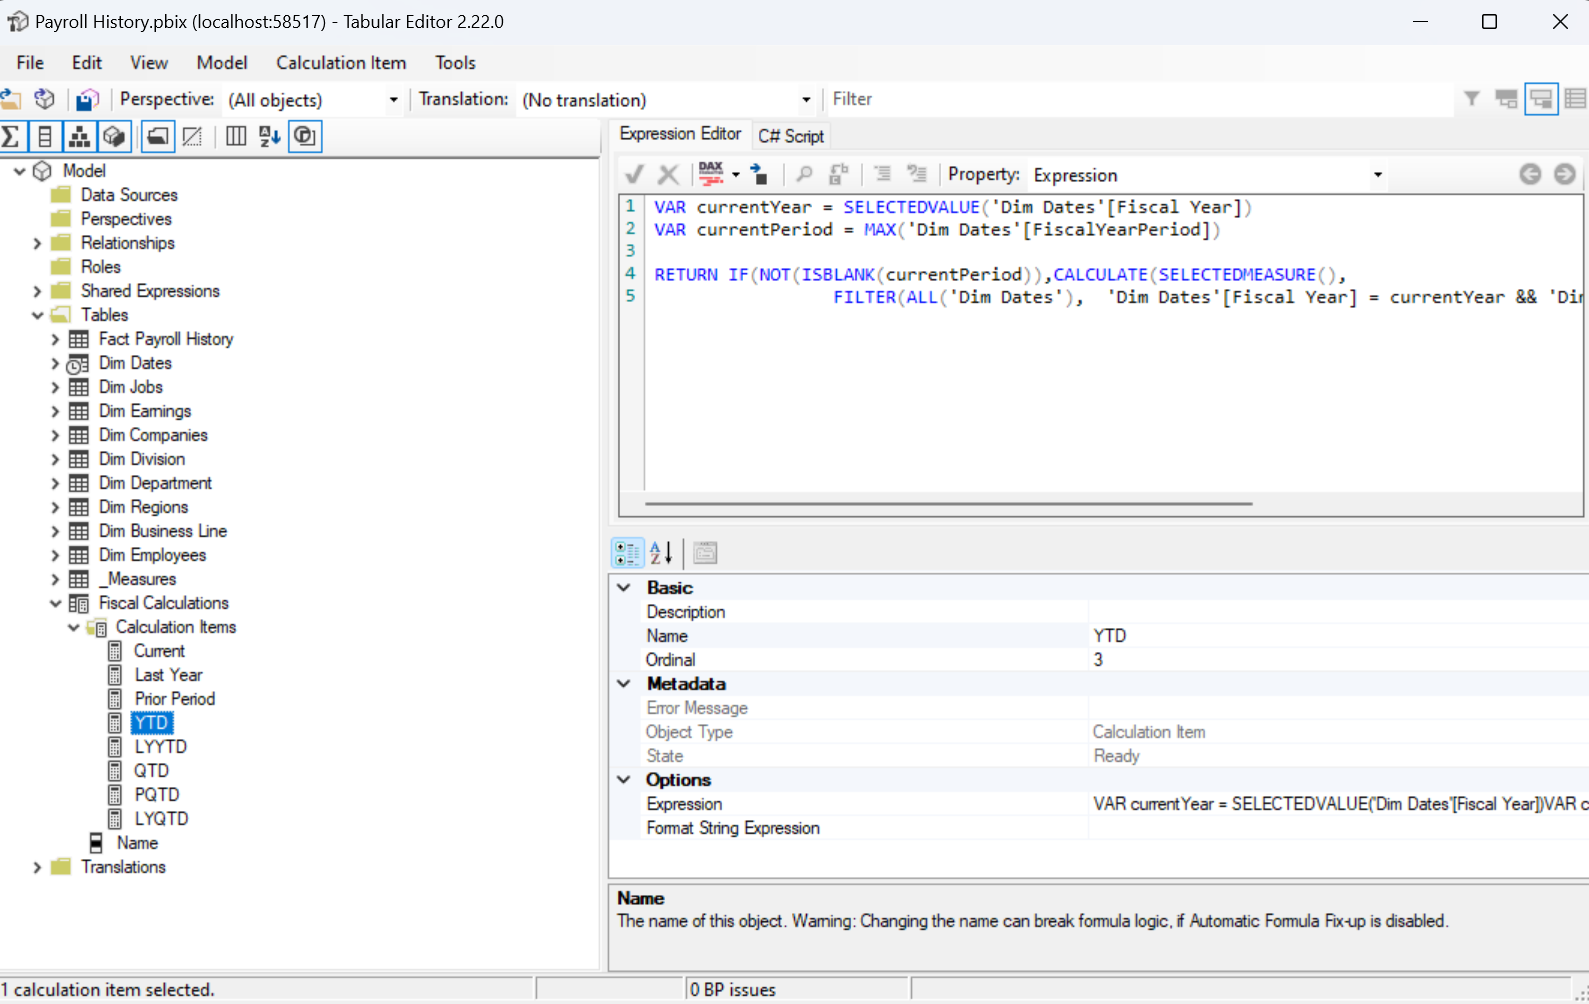
On a technical note, all the measures are built with calculation groups based on Fiscal Year/Period logic. This makes is easy to add more measures across the date ranges:
We can provide the full example – including Cognos Reports, PowerShell, SQL, and Power BI code for 15,000. If you’re interested, contact us.